

Everyone wants a metric.
Fair enough.
Customers need to know whether their security is improving. MSPs need to show that the work they are doing has produced a result. Boards and insurers want something they can compare from one review to the next.
Microsoft Secure Score gives them a number.
Some cyber insurers use it when assessing posture and pricing cover. Microsoft says participating insurers use Secure Score to provide posture-based rates to small and medium-sized businesses.
So the number has weight.
Before you quote it, check the denominator.
What is Microsoft actually measuring?
Secure Score awards points for completing Microsoft-recommended security actions.
Those recommendations come from the supported products and workloads in the tenant. Depending on the environment, that can include identity, applications, data, infrastructure and devices.
A higher score means more of the available recommendations have been completed.
Microsoft also says the score does not measure the absolute likelihood of a breach.
That makes the available points important. A score of 70% means 70% of something. You need to know what that something includes.
What happens when there is no device management?
This is where the headline percentage gets slippery.
If device recommendations are in scope and the customer’s devices are not enrolled, onboarded or properly managed, those points remain open. The score suffers.
Business Premium customers have access to Intune and Defender for Business. Buying the licence does not enrol the devices, deploy the policies or prove that the endpoints are being managed.
There is another version of the same problem.
If device coverage is missing from the assessment altogether, the score can look cleaner than the customer’s operational position really is. Identity and application controls may be doing well while the endpoint estate sits outside the picture.
One customer can have a lower score because its devices are included and there is plenty of work left to do.
Another can show a higher percentage because less of the Microsoft 365 environment is being measured.
You cannot compare those percentages without looking underneath them.
Microsoft gives you more than one score view
Microsoft provides a current licence score and an achievable score alongside the headline result.
The current licence score shows what can be achieved using the customer’s existing Microsoft licences. The achievable score also accounts for recommendations where risk has been accepted.
Those views help explain why two apparently similar tenants have different totals.
Licensing matters. The products in use matter. Device coverage matters. Accepted risks and alternative controls matter.
The percentage still gives you a baseline. Now you know what the baseline covers.
Turn the score into a worklist
A Secure Score report should tell you more than the percentage.
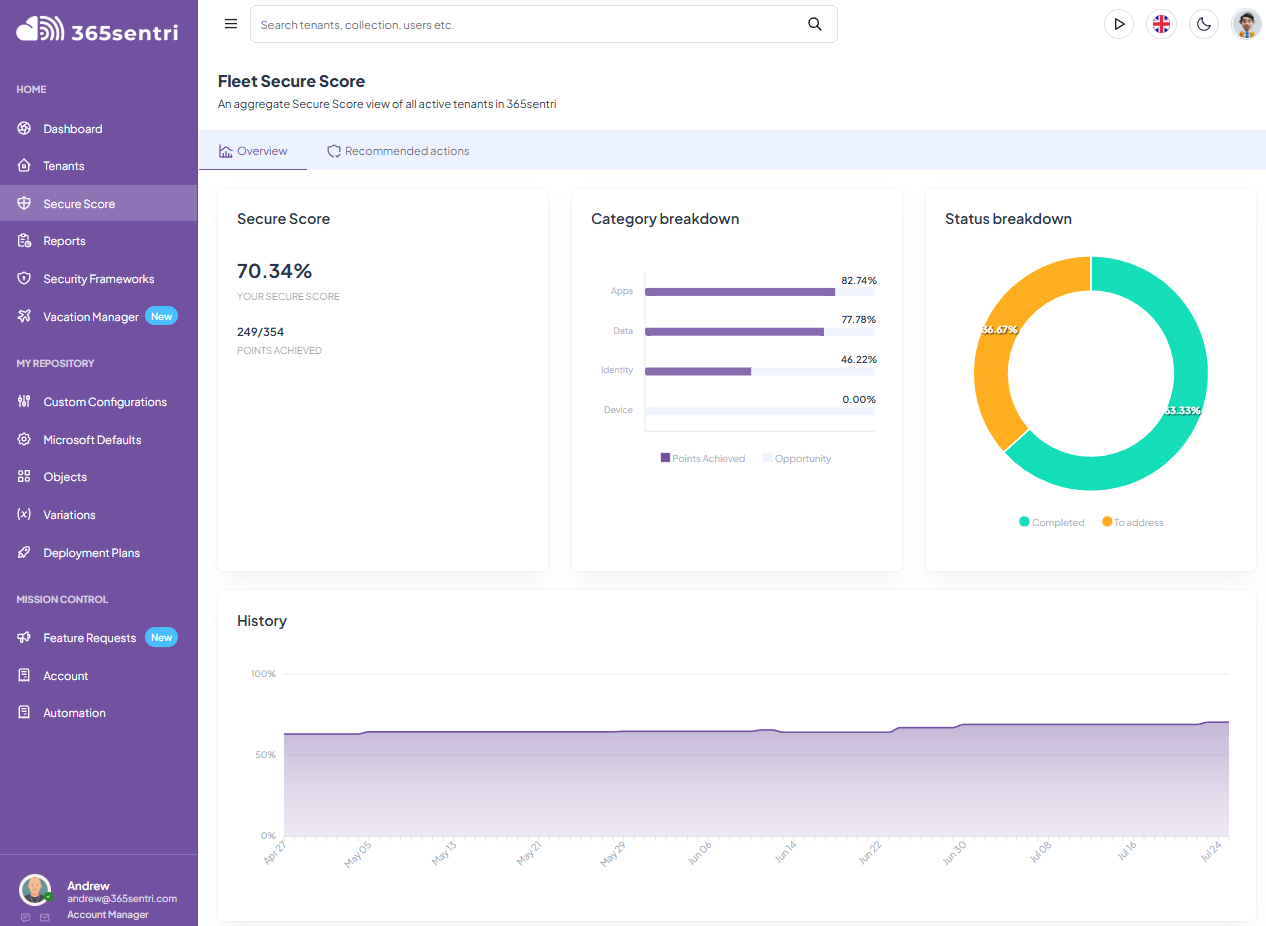
You need to see the available points, the completed points, the categories contributing to the result and the recommended actions still open.
365sentri surfaces that work across connected customer tenants.
Some recommendations map to configurations that 365sentri can remediate. You can review the affected tenants, select the appropriate configuration and apply the change.
Other recommendations need work inside the Microsoft portals. Device enrolment is an obvious example. There may be licensing decisions, deployment planning, user communication and physical devices involved.
There is no sensible one-click answer for all of that.
The work is still surfaced. You know which recommendation is open, which customers are affected and where the remediation needs to happen.
One tenant is a task. A customer fleet is a project.
Working through the recommendations for one tenant is manageable.
Doing the same thing across 20, 40 or 60 customers means opening the same portals, finding the same pages and checking the same controls over and over again.
365sentri lets you look at the score from both directions.
At tenant level, you can see the recommendations affecting one customer.
At fleet level, you can see how many tenants have achieved an action and which ones still need attention.
If you want to run a device-management, identity or email-security uplift project, you can identify the affected customers first. Supported changes can then be applied across the selected tenants. Anything requiring portal work becomes a defined project instead of something buried inside 60 separate scores.
That is how the metric becomes useful.
Give them the number. Then show your working.
Customers and insurers will keep asking for Microsoft Secure Score.
Give it to them.
Then show which Microsoft 365 workloads are being measured, whether the devices are managed, which recommendations remain open and what you are doing about them.
The percentage starts the conversation.
The work underneath it improves the tenant.
Planning a Secure Score uplift project?
Bring us the score, the customer count and the work sitting underneath it. We can show you what 365sentri can remediate, what still needs portal work and how to manage the project across the customer fleet.
Book a demo